Not to my knowledge. There is potential for bringing together some different datasets to start to estimate income generation by area, and if needed, Infometrics could provide an outline of how this could be approached. It is worth noting that the data presented by Infometrics is based on workplace address (where the person works) rather than where they live.
How is the data gathered to inform the Creativity Measure?
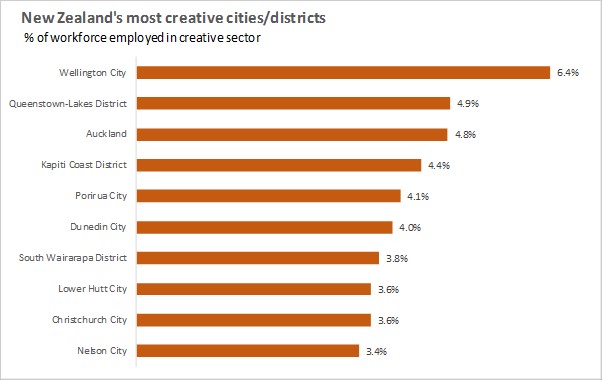
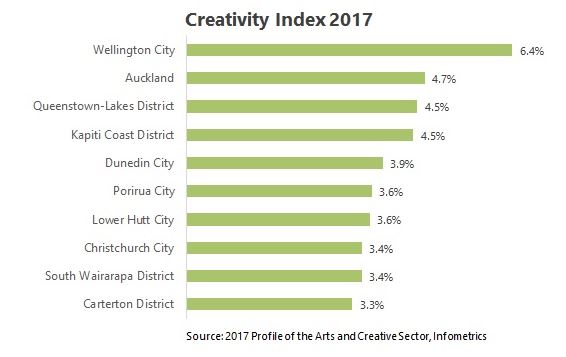
The data that sits behind the Creativity Measure is the number of filled jobs which are in the Arts and Creative Sector, as a proportion of the total filled jobs in an area. The filled jobs data is modelled by Infometrics at a territorial authority level, and is based on LEED (Linked Employer Employee Data) from StatsNZ (based on IRD data) and Business Demography data from StatsNZ. Filled jobs figures are the average filled jobs over a year (to account for seasonal work), and are for the year ending March for the relevant period (so “2018” represents the year ending March 2018.)
What creative occupations are included in the methodology? Is it possible for some to be omitted, that might otherwise be included in other groupings such as Professional Services, Science & Technology? The Arts and Creative Sector is defined by Infometrics, and includes both occupations (using ANZSCO 06) and industries (using ANZSIC 06). Both industries and occupations are combined to create the ‘sector’ to ensure proper capture of the Arts and Creatives sector. The precise Sector Definition for the Arts and Creative Sector is propriety and for subscribers only, but contains 17 different industries and 59 different occupations.
Of the creative workforce identified, is it possible to also identify the percentage that are employees in a creative occupation, self-employed, and average earnings?
Yes it is, to a degree. Infometrics estimates self-employment within sectors based on our modelling of self-employment data from IRD and StatsNZ. Due to the substantial investment into Infometrics’ proprietary data, we would need to attach a fee to provide self-employment insights into the Arts and Creative sector. Average earnings are possible at a national level (but not a regional level) for different sectors. These insights would also incur a fee.
Why has the gap widened between Wellington city and other regions over the past 10 years?
Broadly speaking, Wellington City’s growth in the number of people working in the Arts and Creative sector has been larger than in other areas. Over the last 10 years, Wellington City has contributed 12% of the total growth in jobs in the sector nationwide.
Is it possible to see the full table of 66 territorial authorities? ie. more than the top 10?
The Creativity Measure article published in 2019, and similar articles in previous years, are designed to stimulate conversation and provide a limited overview to the insights into the sector. The full table can be accessed with a subscription to the Arts and Creative sector, which incurs a fee (again, this is because of the investment Infometrics has made compiling and modelling the dataset).
What are the research limitations of the Creative Measure?
As noted above, the Creativity Measure is created around a set definition compiled by Infometrics, which may include or exclude areas of interest, or areas that different people may see as more or less relevant to being part of a “Arts and Creative Sector”. Given the data is modelled, based on a range of data inputs including various Census datasets, Business Demography data, LEED and other sources, the data provided is an estimate only. However, it is a robust estimate used by a range of organisations across New Zealand, with a significant number of local councils, tertiary education provides, and businesses using Infometrics insights to inform their decision making.
Is there another question we haven’t thought to ask or any other information that would be good to know?
We update our data based on our best understanding of the economy when we publish. As a note, the data provided as part of the 2018 Creativity Measure does not include Census 2018 data (which would generally help us to understand employment insights). Due to the issues with Census 2018 data, we are still evaluating what employment insights we are able to reliably include from the 2018 Census, so it might be that in future we revise our current assessment of the size and composition of the Arts and Creative Sector.
In real terms, with close access to Wellington City and reduced travel times after Transmission Gully opens, our region will potentially be in a much stronger position than before to leverage our creative potential. So whilst measuring is important and useful for quantifying value in the eyes of potential investors, how we support each other, how we strategically develop as a sector, strengthen our creative practice, develop sustainable incomes and retain and attract new audiences and raise the value of creativity in the hearts and minds of the public is going to be the true measure of creativity in our region.