Cities, towns and districts like to cultivate a reputation for being creative places, knowing this attracts a younger workforce, business investment and tourists. Peel back the marketing campaigns however, and it can sometimes look a little different.
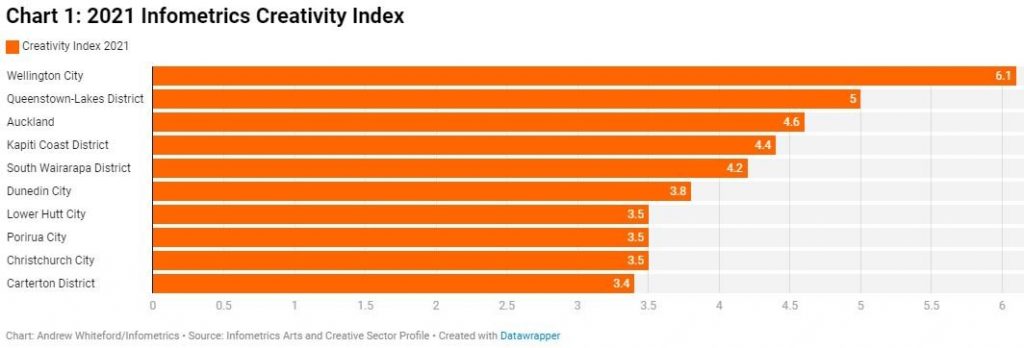
The annual Infometrics Creativity Index is a consistent tool for measuring the proportion of the workforce employed in the arts and creative sector. Launched in the year 2000, the Kāpiti Coast entered in fifth position (with 3.4% of the local workforce employed in the arts and creative sector) after Wellington City, Queenstown Lakes District Council, Auckland, and Porirua. Since then, and in the past six years, the Kāpiti Coast has barely deviated from 4.4% whilst Porirua is now slightly behind where it started in 2000.
Statistics in and of themselves may not make for the most exciting news to report – except when this is the only creative workforce measurement tool available in the country. When one also takes into account the significant, and in some cases, devastating impact of Covid-19 on the creative industries, with loss of highly skilled creative and technical roles likely to impact recovery and resilience for years to come, maintaining the status quo is actually a sector achievement.
The first 21 years for both Kāpiti and Porirua reveal two completely different creative workforce patterns. There can be no doubt however that the Wellington region with it’s city and districts in the top 10, is nationally significant and its creative workforce worthy of investment to leverage existing strengths.
Kāpiti Coast
2000 – 3.4% (5th in NZ)
2010 – 3.7% (5th in NZ)
2016 – 4.4% (4th in NZ)
2017 – 4.5% (4th in NZ)
2018 – 4.2% (4th in NZ)
2019 – 4.4% (4th in NZ)
2020 – 4.4% (4th in NZ)
2021 – 4.4% (4th in NZ)
Porirua
2000 – 3.6% (4th in NZ)
2010 – 3.2% (10th in NZ)
2016 – 4.1% (5th in NZ)
2017 – 3.6% (6th in NZ)
2018 – 3.4% (9th in NZ)
2019 – below 3.4% (not in the top 10 in NZ)
2020 – 3.4% (10th in NZ)
2021 – 3.5% (8th in NZ)